Understanding Nutritional Composition of Everyday British Foods
Educational content only. No promises of outcomes.
Understanding Energy Density in Everyday Foods
Energy density refers to the number of calories (kilocalories) provided by a unit of food or beverage, typically measured per 100 grams. This concept is fundamental to understanding the nutritional profile of foods and how different ingredients and preparation methods affect their overall composition.
Foods with lower energy density provide fewer calories per unit weight, while those with higher energy density are more calorie-concentrated. The energy density of food is determined by its water, fibre, and fat content. Understanding these differences enables evidence-based assessment of food composition without prescriptive judgment.
Breakfast Items Comparison
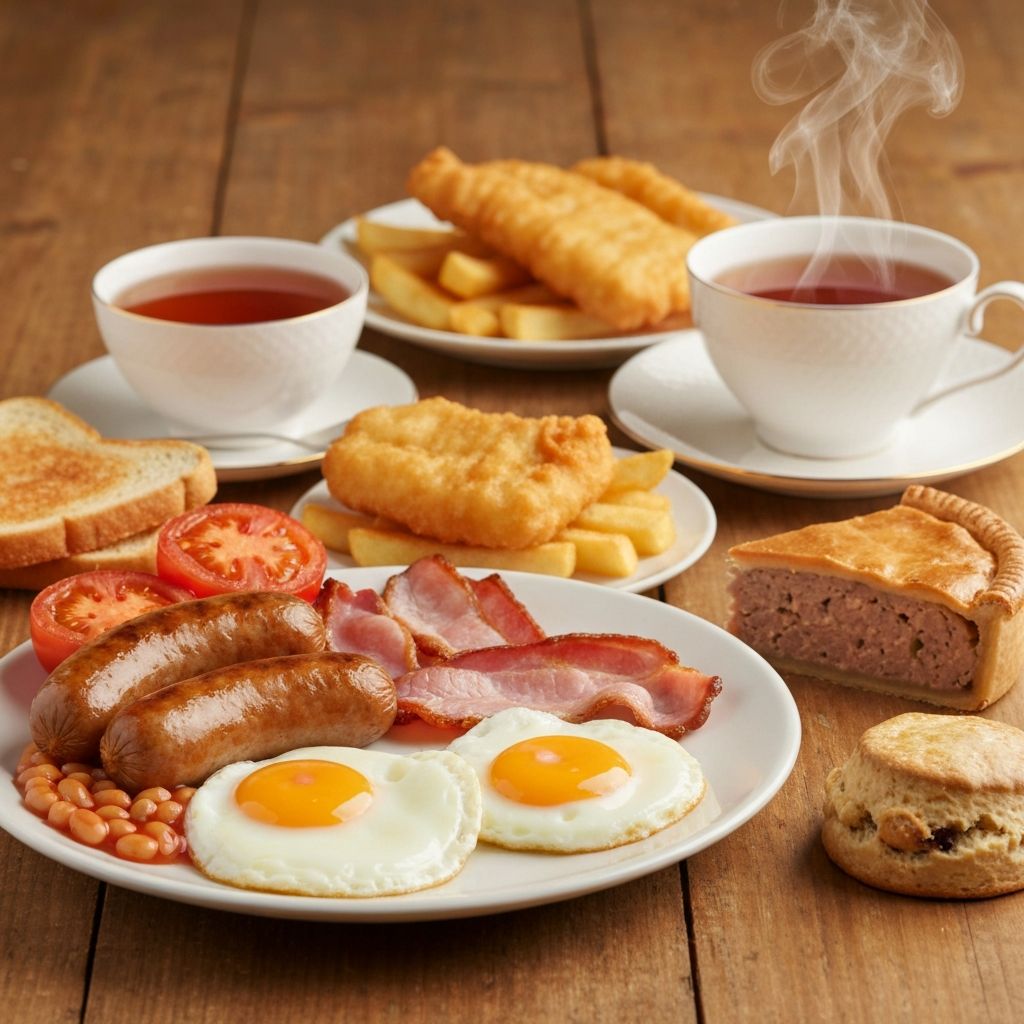
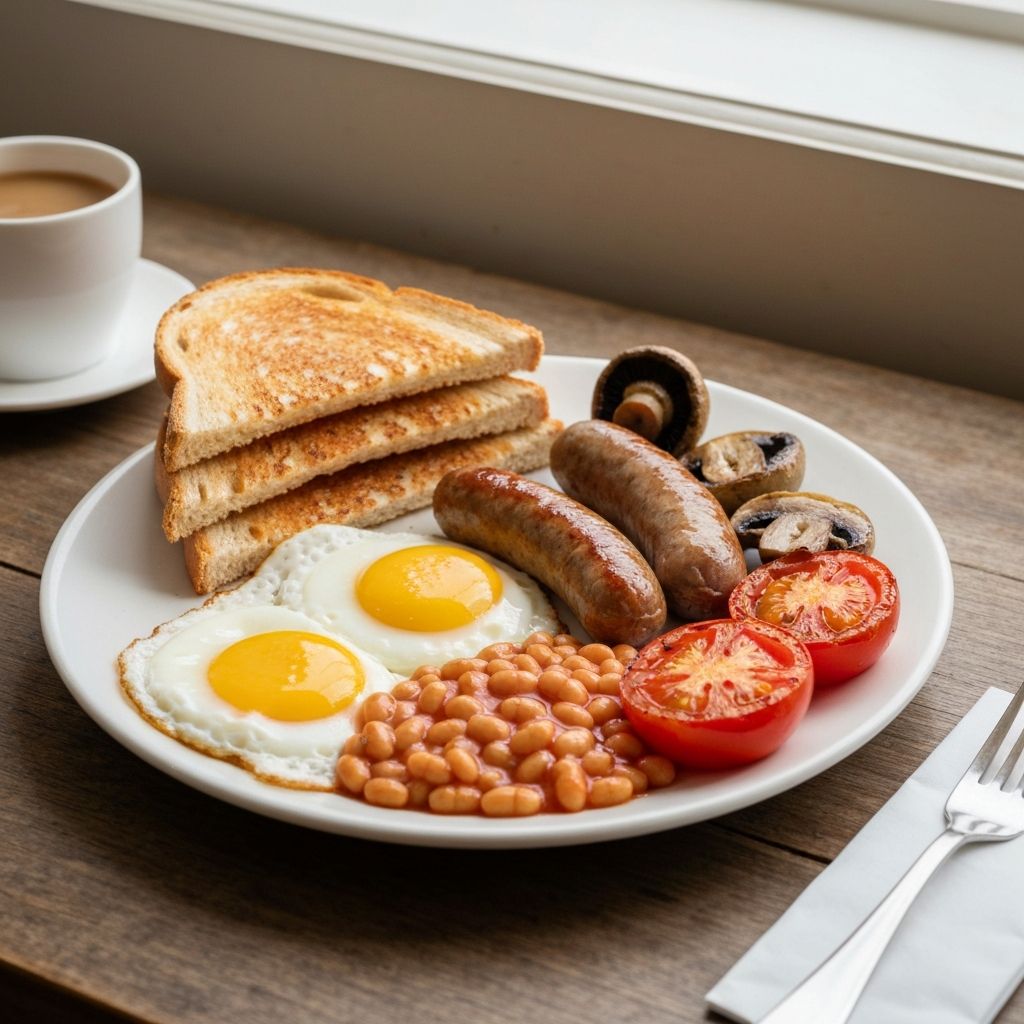
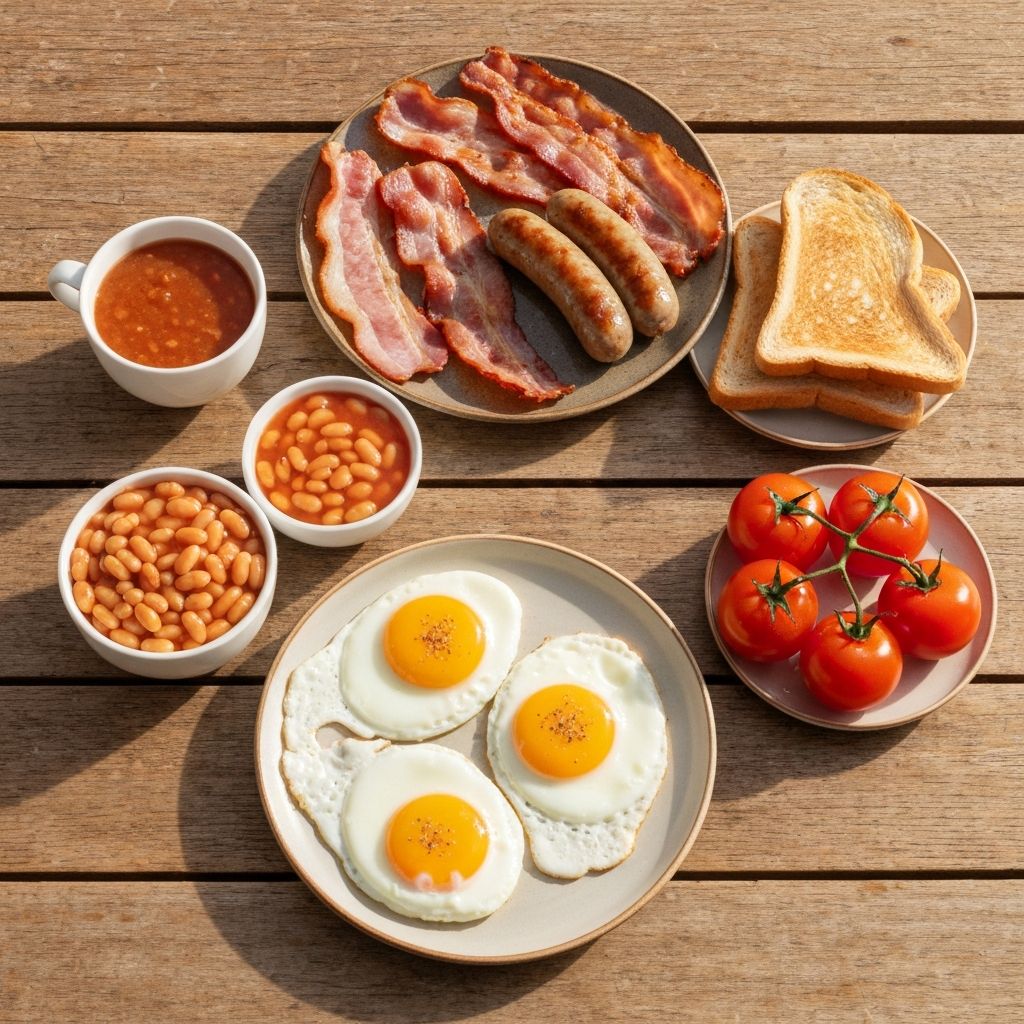
A traditional Full English breakfast comprises several components, each with distinct nutritional profiles. The following table presents the energy and macronutrient composition per 100g and typical serving size:
| Item | Per 100g (kcal) | Typical Portion (g) | Portion (kcal) | Protein (g/100g) | Fat (g/100g) | Fibre (g/100g) |
|---|---|---|---|---|---|---|
| Fried Egg | 155 | 60 | 93 | 13 | 11 | 0 |
| Bacon (grilled) | 202 | 30 | 61 | 28 | 11 | 0 |
| Sausage (pork) | 258 | 50 | 129 | 13 | 17 | 0 |
| Baked Beans | 81 | 130 | 105 | 5 | 0.4 | 5 |
| White Toast | 265 | 36 | 95 | 9 | 1.5 | 1.5 |
| Whole Grain Toast | 249 | 36 | 90 | 10 | 2 | 5 |
Lunch Classics Nutritional Profiles
Lunchtime staples in the UK context include sandwiches, jacket potatoes, and soups. Each category encompasses a range of compositions depending on fillings, preparation methods, and ingredient selection:
- Sandwich (white bread, typical filling): 280-350 kcal per serving, protein 8-12g, fat 8-15g
- Sandwich (whole grain, typical filling): 270-330 kcal per serving, protein 10-14g, fat 7-13g, fibre 4-6g
- Jacket Potato (with butter): 300-400 kcal, protein 5g, fat 8-12g, fibre 3-4g
- Lentil Soup: 120-160 kcal per 250ml portion, protein 8-10g, fibre 4-6g
- Chicken & Vegetable Soup: 80-120 kcal per 250ml portion, protein 6-8g, fibre 1-2g
The nutritional variation reflects ingredient composition, portion sizes, and cooking methods employed in typical UK lunch preparations.
Traditional Dinner Dishes
Traditional British dinner dishes demonstrate substantial variation in energy density and macronutrient composition:
| Dish | Per 100g (kcal) | Typical Serving (g) | Serving (kcal) | Protein (g) | Saturated Fat (g) |
|---|---|---|---|---|---|
| Fish (battered, fried) | 218 | 150 | 327 | 15 | 2 |
| Fish (grilled) | 163 | 150 | 245 | 22 | 1.5 |
| Chips (deep fried) | 312 | 150 | 468 | 3 | 3.5 |
| Meat Pie | 286 | 150 | 429 | 11 | 8 |
| Steak & Kidney Pie | 295 | 150 | 442 | 13 | 9 |
| Shepherd's Pie (beef) | 156 | 200 | 312 | 11 | 4 |
| Curry with Rice | 180 | 200 | 360 | 10 | 2.5 |
Snacks and Accompaniments
Everyday British snacks and tea accompaniments vary significantly in energy density and macronutrient composition:
Digestive Biscuit
Per 100g: 471 kcal
One biscuit (30g): 141 kcal
Fat: 21g, Fibre: 2g
Crisps (ready salted)
Per 100g: 530 kcal
Small packet (30g): 159 kcal
Fat: 35g, Saturated Fat: 5g
Homemade Oat Biscuit
Per 100g: 420 kcal
One biscuit (30g): 126 kcal
Fat: 17g, Fibre: 3g
Victoria Sponge Cake
Per 100g: 345 kcal
Typical slice (80g): 276 kcal
Fat: 17g, Sugar: 26g
Carrot Cake (homemade)
Per 100g: 312 kcal
Typical slice (80g): 250 kcal
Fat: 14g, Fibre: 2g
Almonds (raw)
Per 100g: 579 kcal
30g serving: 174 kcal
Fat: 50g, Fibre: 3.5g

Tea Time Items
Traditional British tea time items exhibit varied nutritional profiles:
- Scone (plain): 330 kcal per 100g, protein 7g, fat 15g, fibre 1.5g
- Scone (with cream and jam): Complete serving approximately 350-400 kcal
- Crumpet (plain): 202 kcal per 100g, protein 4g, carbohydrates 43g, fibre 0.6g
- Crumpet (with butter): Per crumpet approximately 80g yields 200-220 kcal
- Sliced White Bread: 265 kcal per 100g, protein 9g, fibre 1.5g
- Sliced Wholemeal Bread: 249 kcal per 100g, protein 10g, fibre 5.8g
- Hot Tea (with semi-skimmed milk, no sugar): Approximately 10-15 kcal per cup
The composition reflects both traditional and contemporary preparation methods commonly found in UK tea culture.
Role of Fibre and Protein in Satiety
Evidence-based research indicates that fibre and protein content influence satiety signals and the duration of fullness perception. This represents a physiological mechanism rather than a dietary prescription.
Fibre in Food Composition:
- Soluble fibre (found in oats, beans, some vegetables) contributes to viscosity in the digestive tract
- Insoluble fibre (found in whole grains, vegetables) affects gastric emptying rate
- Typical intakes in UK population: 18-20g daily; recommended intake: 30g daily for adults
- Fibre content influences overall energy density—high-fibre foods typically provide fewer calories per unit weight
Protein in Food Composition:
- Protein demonstrates higher thermic effect compared to carbohydrates or fats—meaning more energy required for digestion
- Protein-rich foods are associated with longer duration of satiety signals
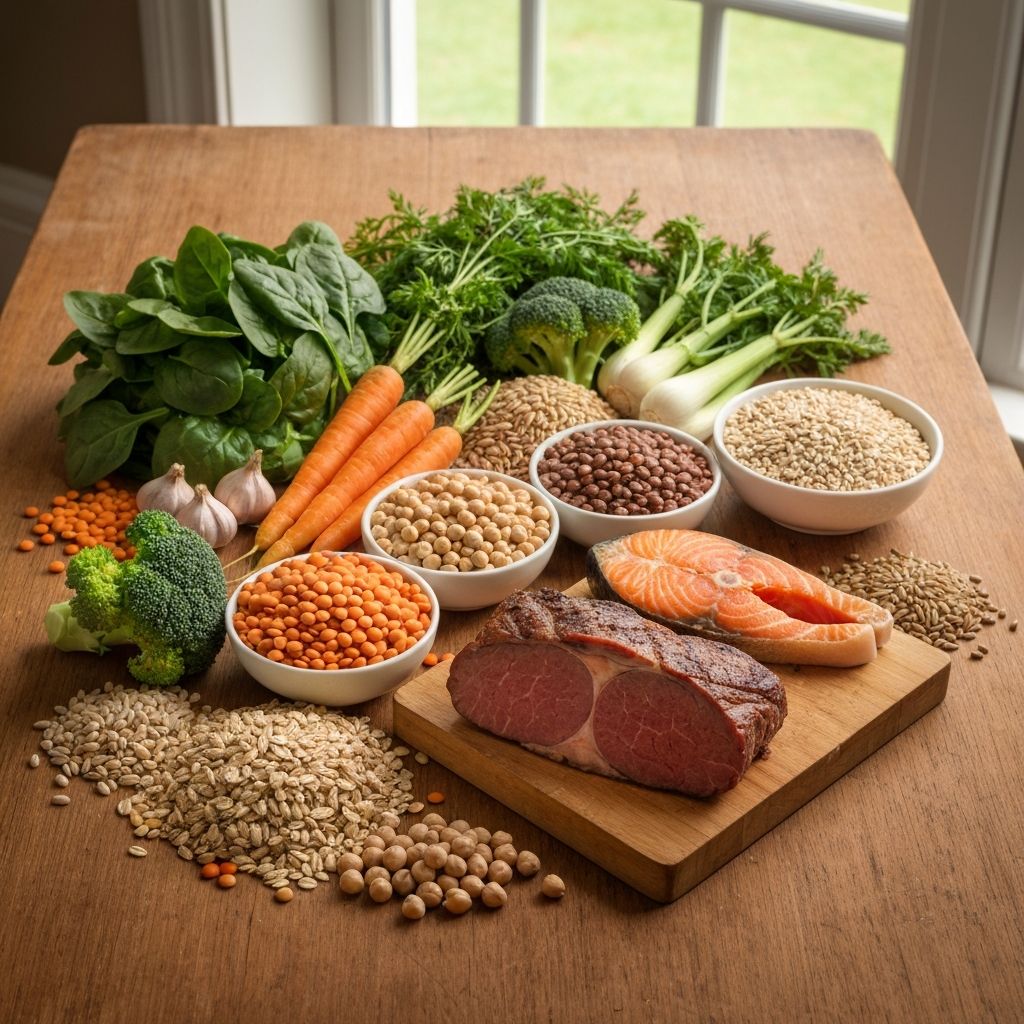
- Typical UK protein sources: meat, fish, eggs, legumes, dairy products
- Protein content varies significantly: chicken breast 31g/100g vs. white bread 9g/100g
These physiological mechanisms represent factual observations documented in nutritional science literature, presented without dietary guidance or recommendations.
Impact of Preparation Methods on Nutritional Profile
The method of food preparation significantly affects the total energy content and macronutrient composition of a dish. The following examples illustrate this variation:

Preparation Method Comparison
| Preparation | kcal/100g | Fat (g) |
|---|---|---|
| Fish (fried) | 218 | 11 |
| Fish (baked) | 163 | 5 |
| Fish (grilled) | 148 | 4 |
| Potatoes (fried chips) | 312 | 17 |
| Potatoes (baked) | 77 | 0.1 |
| Potatoes (boiled) | 72 | 0.1 |
The data demonstrate that preparation method—specifically the addition of fats through frying—alters the total energy value while protein content remains relatively stable. Ingredient selection (type of fat used, breading inclusion) further modifies the composition.
Links to Detailed Food Group Comparisons
Explore in-depth analysis of specific food categories and their nutritional profiles:
Nutritional Breakdown of Full English Breakfast Components
Item-by-item analysis of traditional Full English breakfast elements, composition data, and variations.
View the nutritional comparison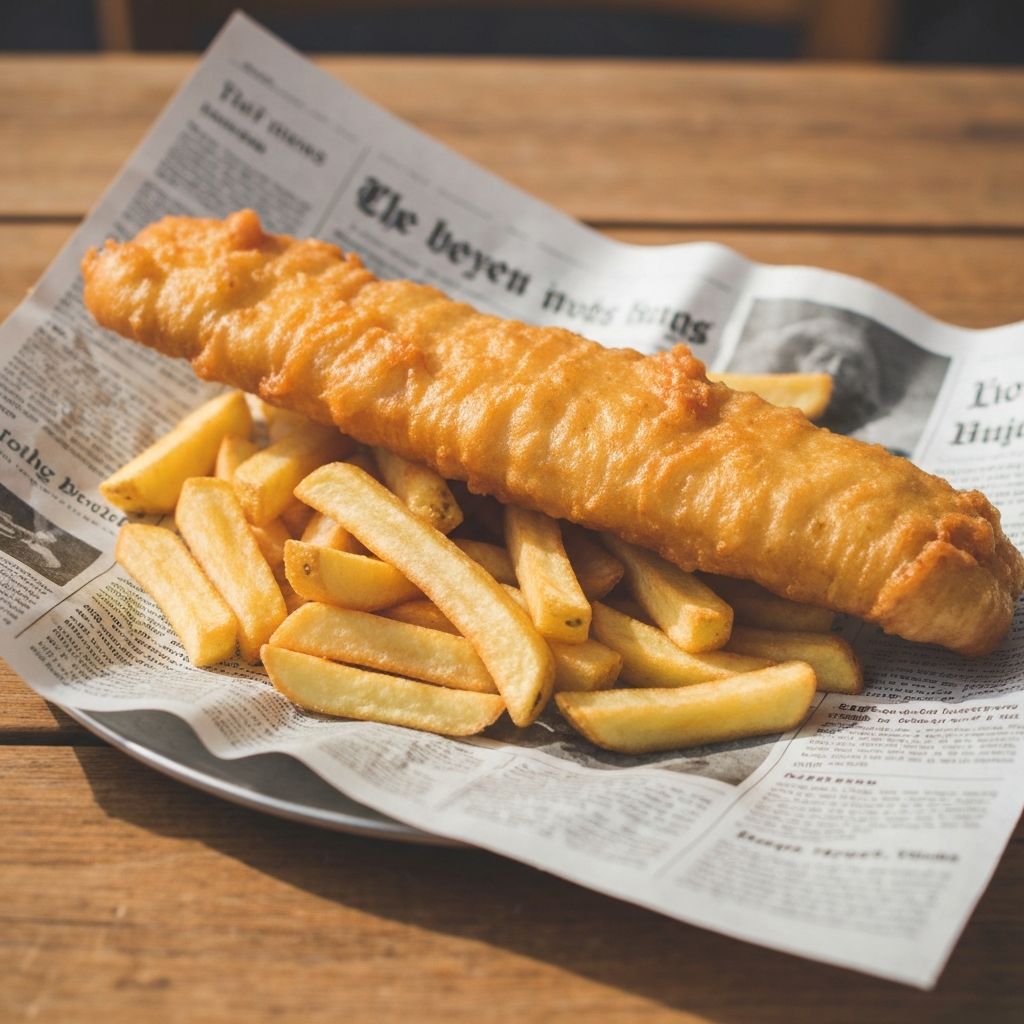
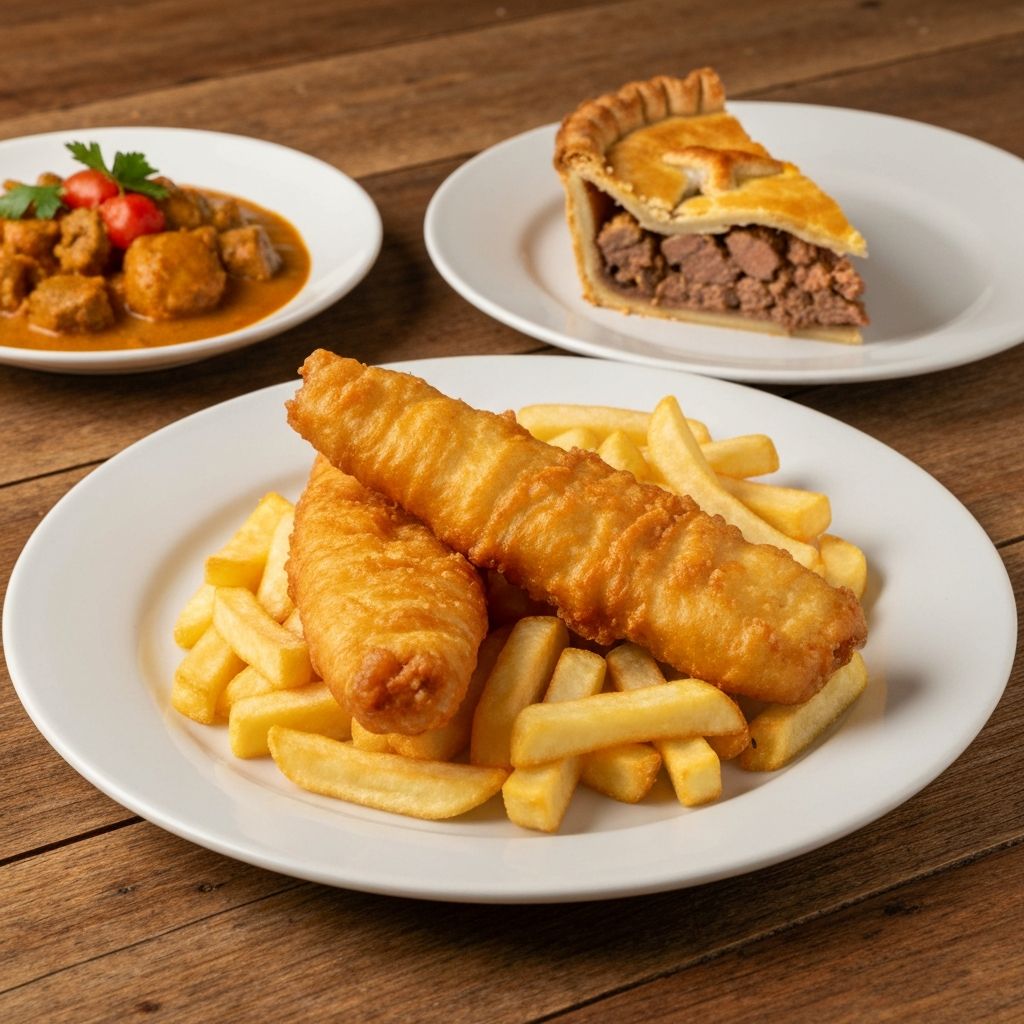
Fish & Chips: Energy Density and Macronutrient Profile
Classic British dish analysis, energy content comparison, battered versus non-battered variations.
Learn about energy density
British Pies and Pastry Dishes: Composition Insights
Analysis of traditional and modified pie variations, pastry composition, and nutritional profiles.
Explore food composition data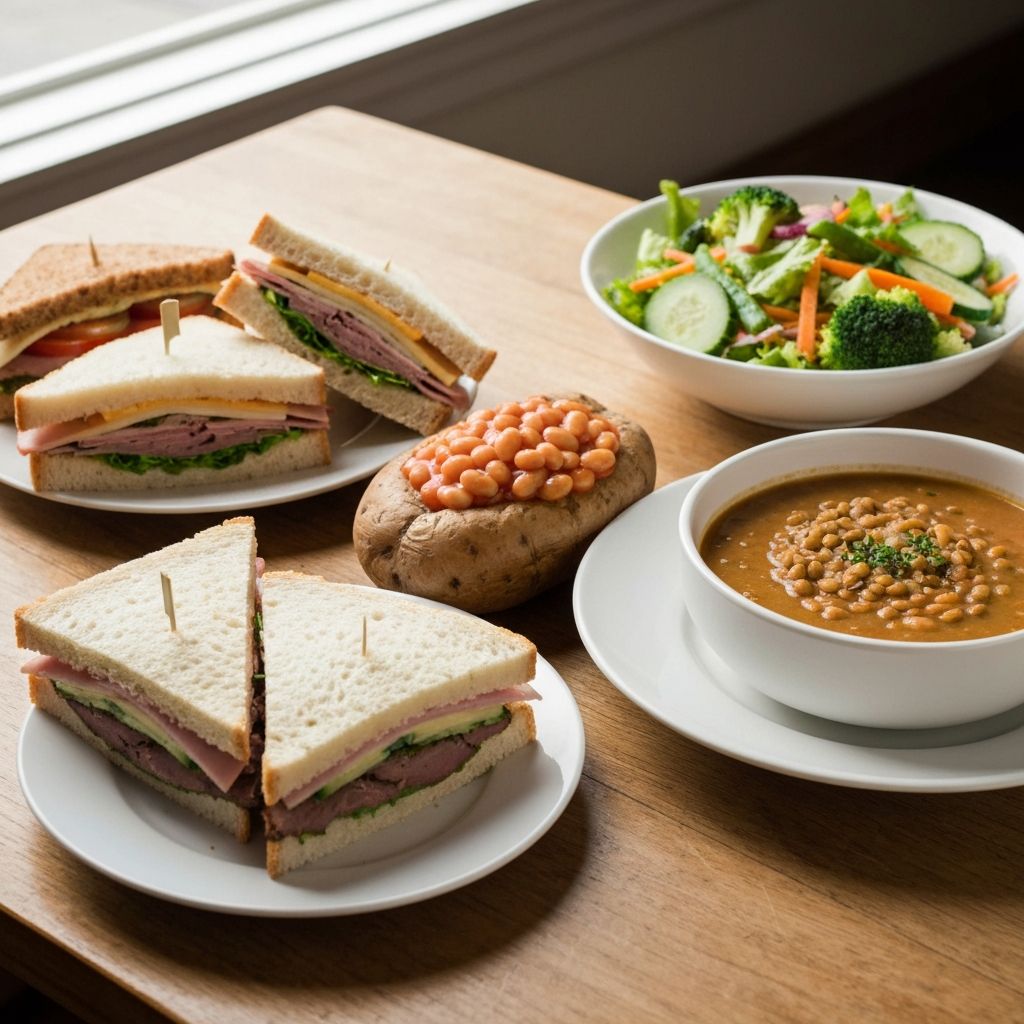
Sandwiches and Lunchtime Staples in UK Context
Nutritional profiles of common sandwich fillings, bread types, and preparation variations in UK context.
View related everyday food data
Biscuits, Cakes and Sweet Snacks Comparison
Everyday tea accompaniments analysis, biscuit compositions, cake variations, and snack profiles.
Read the full nutritional comparison
Role of Fibre-Rich Alternatives in Traditional Meals
Scientific context on fibre function, whole grain composition, and evidence-based food composition data.
Learn more about food compositionCommon Misunderstandings About Food Choices
Research in food science and nutrition has clarified several points frequently subject to misinterpretation:

- Energy density and overall diet composition. Understanding that a food has higher energy density does not inherently indicate it is unsuitable for inclusion in any dietary approach. Food selection depends on individual context and overall diet patterns, not single food characteristics.
- Macronutrient balance varies by context. The optimal ratio of protein, fat, and carbohydrates remains subject to scientific debate and varies by individual factors, activity level, and metabolic context. No universal prescription exists.
- Preparation method as neutral information. Documenting that frying adds energy via fat is factual information about food composition, not a recommendation for or against fried foods.
- Fibre and satiety as physiological mechanism. The observation that higher-fibre foods are associated with satiety signals describes a biological mechanism, not dietary guidance.
- Individual differences in food response. People respond differently to the same food based on genetics, metabolic health, activity patterns, and numerous other factors. Food composition data does not predict individual outcomes.
- Cultural and culinary context matters. Traditional British foods carry cultural significance and culinary meaning beyond their nutritional composition. This context cannot be separated from food selection in real-life settings.
Frequently Asked Questions
Explore Nutritional Profiles of British Foods
Browse detailed comparisons, composition tables, and evidence-based information about the foods you encounter in everyday British culinary contexts: